Age Graded Performance Tables
| Discipline | The athletic event (e.g., 100m, Long Jump, Shot Put) |
|---|---|
| Mark | The performance achieved (e.g., 10.23 seconds, 7.45 metres) |
| Age | The age of the athlete at the time of the performance |
| Gender | The gender category of the performance (e.g., Men, Women) |
| Performance Level | The corresponding age-graded percentage or classification (e.g., 85%, National Class) |
| Governing Body | The organization that ratifies the tables (e.g., World Athletics) |
| Calculation Basis | The statistical method used to create the standards (e.g., Percentiles from world records) |
Origin and history
Age Graded Performance Tables originated in the United Kingdom in the late 20th century. They were developed to provide a unified system for comparing athletic performances across different age groups and genders. The concept was pioneered by statisticians and athletics enthusiasts within the British athletics community. Their work was driven by the need for a fair method to handicap performances in masters (veterans) athletics competitions. The initial tables were constructed through the analysis of world record progressions and observed performance declines with age. These foundational tables have been periodically refined and updated as more global performance data has become available.
What it is for
Age Graded Performance Tables are used to calculate a percentage score that represents how close an athlete's performance is to the current world record for their age and gender. The primary purpose is to enable direct comparison of performances across different events, ages, and sexes. They are extensively used in masters athletics to determine winners in multi-event competitions where athletes compete in different disciplines. Coaches utilize the percentages to objectively assess an athlete's current fitness level relative to their age-based potential. The tables also allow veteran athletes to track their performance trajectory against the expected rate of age-related decline. Furthermore, they provide a motivational tool by giving older athletes a clear standard to aim for, irrespective of the absolute distance or time.
Overview
Age Graded Performance Tables consist of a comprehensive set of data tables, one for each standard track and field event. Each table lists a benchmark "world best" performance for every single age and for both men and women. For a given performance, such as a 45-year-old woman running 5000 meters in 20:30, the corresponding table provides the age-graded standard for that demographic. The athlete's actual time is then compared to that standard to produce a percentage score. An age-grading score of 100% represents a performance equal to the world record for that age and gender. The system covers all standard running distances from sprints to the marathon, as well as jumping and throwing events. The calculations account for the non-linear rate of performance decline, which accelerates in later decades.
What to know
The world best standards within the tables are not static and are updated periodically by the governing bodies that maintain them. Different organizations, such as World Athletics Masters Associations and national bodies, may publish slightly varying tables, though the core methodology is consistent. It is crucial to use the correct table version and the specific set of tables designated for "age-grading," as there are also separate tables for calculating scoring in combined events like the decathlon. The percentage score is the primary output, but many systems also calculate an "age-standard" time or distance, which is what the athlete would have achieved at their peak age. The tables are based on empirical data of elite performance decline and do not account for individual variations in training history or late-life training commencement.
Common questions
A common question is whether the tables are fair to athletes who take up the sport later in life, as they may improve rapidly while the tables predict decline. Another frequent inquiry concerns how the tables handle differences in event popularity and depth of competition, which can affect the quality of the world best data for niche events. Many ask if the age-graded percentages can be used to qualify for championships, which is typically not the case as qualifying standards are based on absolute performance. Athletes often question why their age-graded percentage might drop from one year to the next even if their absolute performance remains the same, which occurs because the expected standard becomes slightly easier each year as they age. People also commonly confuse age-grading with age division rankings, which simply compare performances within a five-year age group without a world-best benchmark. Finally, there is often discussion about the accuracy of the tables for the very oldest age categories, where world best data is most scarce.
Pros and cons
A significant pro is that the system provides extraordinary motivation and a clear framework for goal-setting for masters athletes, allowing a 70-year-old to meaningfully compare their effort to a 40-year-old's. It also brings a unifying fairness to multi-discipline competitions in masters meets. A major con is that the tables can sometimes demotivate athletes in their prime younger years, as achieving a very high percentage becomes increasingly difficult against open-age world records. A common mistake is for athletes to become overly focused on their percentage to the detriment of their absolute performance goals or the simple enjoyment of competition. Many who rely solely on age-grading for performance assessment regret not also tracking their absolute personal bests over time, as the tables can mask an actual performance decline if the age-allowance outpaces it. The system also faces criticism for potentially being less accurate for non-running events and for older age groups where verified world bests are limited.
Who it suits
Age Graded Performance Tables are ideally suited for masters athletes, typically those aged 35 and over, who compete against others in wide age ranges. They are particularly valuable for participants in multi-event competitions like pentathlons or for clubs that field mixed-age and mixed-gender teams. Coaches working with veteran athletes find them indispensable for setting realistic, data-informed training targets and for evaluating progress relative to age norms. The tables also suit sports statisticians and event organizers who need a single metric to rank performances across many different event types for awards or selection purposes. They are less relevant and rarely used by elite open-age athletes competing at the highest level of the sport, where absolute times and distances are the sole currency. Recreational runners or throwers who do not compete formally may also find the tables an interesting analytical tool for personal benchmarking.
Latest Age Graded Performance Tables news
Latest reporting

Coaches Spend $300 on Running Gains
Two running coaches detail how they would spend $300 to improve performance, with one prioritizing a race entry, shorts, and nutrition, and the other

Bui’s Plan Cuts Half Marathon Workouts
Anh Bui, a DPT and CSCS coach, shows how a 40-minute strength routine can fit into half-marathon training, reducing heavy lifts, adding supersets...
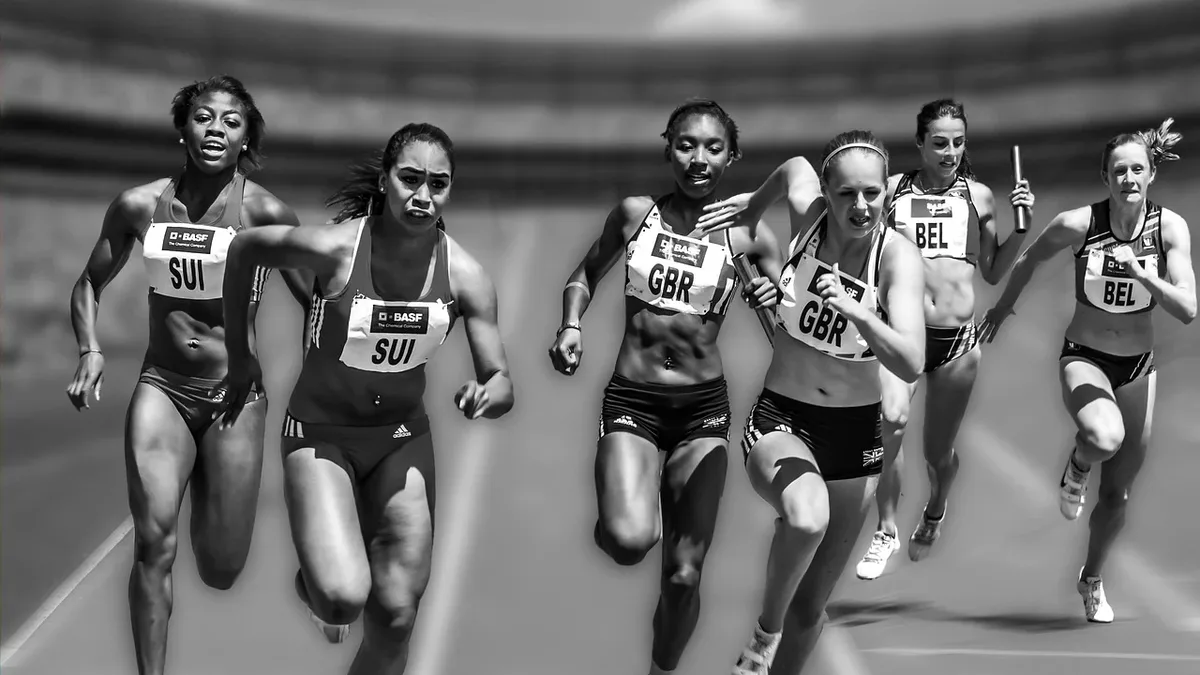
Downhill Training for Endurance: A Key to Late-Race Performance
Ultrarunner and coach David Roche shares his approach to downhill training as a way to build durability and prepare for long-distance races.